
By using our website, you agree to the use of cookies as described in our Cookie Policy
Blog
2020 Election Preview
Despite all the turmoil in the world, led by COVID‐19, the US Presidential Election horserace has had a very consistent result for months: Joe Biden is clearly leading, but Donald Trump still has enough time and space to come back.
 Photo by: Element5 Digital from Pexels
This headline is both boring and mushy—boring because it doesn’t skew towards momentum‐based speculation that the race is tightening, and mushy because it’s not proclaiming Biden as the clear winner.
As of September 25th, the current state of the race is:
- Biden leads the national popular vote by about 6‐8 points.
- Trump has a significant electoral college advantage, most likely about 3 points, but possibly as high as 5‐6 points. So if Trump loses the popular vote by 3 points, he’s still an even bet to win reelection, and it’s conceivable that Trump could lose by double the margin and still retain the presidency.
- Data analysts we’ve reviewed give Trump about a 15‐30% chance to win. Trump’s path to winning would likely be through a combination of race tightening (large leads tend to diminish as election day approaches), polling error, and the electoral college advantage.
If you want more resources on election analysis, we have a few websites and individuals to suggest:
- Nate Silver and the website https://fivethirtyeight.com/. There’s some quibbling among election experts with respect to model design (with 538’s model having more uncertainty embedded, and hence a greater chance of a Trump comeback), but the broad brush views are the same— Biden is favored, but far from a lock. 538 also has an interesting scenario analysis at https://projects.fivethirtyeight.com/2020‐election‐forecast/. For September 25th, Biden has a 77% chance of winning, and Trump 23%; moreover, according to simulations:
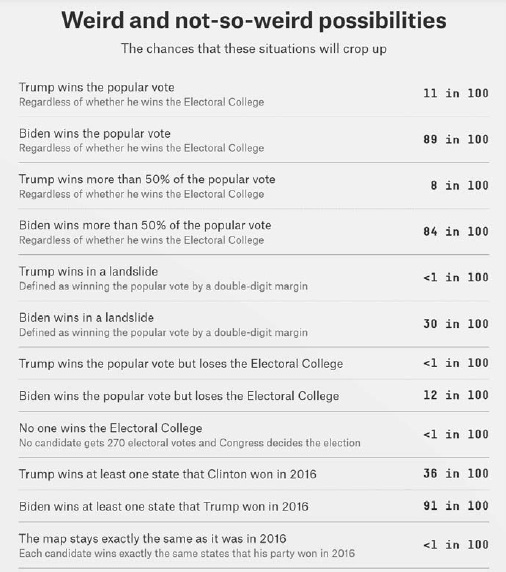 Source: Weird and not‐so‐weird possibilities. Graph from FiveThirtyEight.com. September 25, 2020. n. pag.
Over 50% of Trump’s victory scenarios are a repeat of 2016, in which Trump loses the popular vote but wins the electoral college. And, though media talk tends to focus on tightening or a Trump comeback—understandably, given the stakes of winning or losing this election, and the excitement of a close horserace‐‐it’s also worth noting that Biden’s chances of winning the popular vote by over 10% are greater than Trump’s chances of winning the election. The range of plausible outcomes is between a narrow Trump victory and a Biden blowout. - Sean Trende and https://www.realclearpolitics.com/elections/2020/. Real clear politics displays recent polls and their averages. The benefit of such an approach is that it’s simple and transparent, in contrast to proprietary models like the one at 538. Between 9/10 and 9/23, for instance, Biden’s national polling lead ranged from 1 to 10 points, with an average of 6.6 points. The downside to simple averaging is that the average will probably be more bouncy than it should be, depending on which polls have conducted recent surveys. Every pollster has to model the likely electorate, with some models tending to yield relatively favorable results for Trump, and others for Biden. So if Rasmussen and some other Republican‐leaning pollsters release poll results tomorrow, the average is likely to shift towards Trump, yielding a false sense of momentum. The converse can be true as well, in which Biden would appear to be increasing his lead, but only because recent polling has been by companies whose models tend to be favorable for Biden.
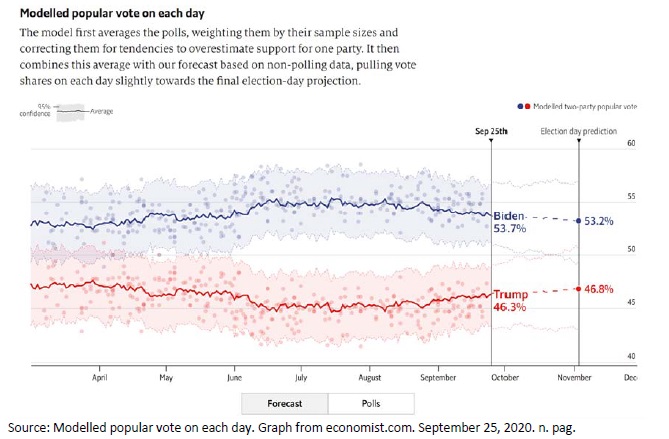
- G Elliott Morris of The Economist. The Economist has a terrific election forecasting website at https://projects.economist.com/us‐2020‐forecast/president. Morris also shares a lot of insight on his twitter account (as do all the analysts mentioned above and below). The forecast has an interesting state correlations map near the bottom of the webpage. Note that Pennsylvania, Michigan, and Wisconsin are all highly correlated, so that if Biden or Trump wins one of these states, he has an excellent chance of sweeping all three. In fact, the failure to appreciate correlation between states was one of election pundits’ largest failures in 2016—Clinton’s supposed Rust Belt “blue wall” was brittle, in that if there was a 5 point polling error for one state, other states would likely fall as well.
Besides benefiting from a larger polling lead, Biden’s paths to victory are more diversified than Clinton’s ever were. Biden can win by reclaiming Pennsylvania, Michigan, and Wisconsin, but he also is leading in Florida and Arizona, and is very close in North Carolina, Georgia, and Texas. To be sure, Biden could lose all of these states, but part of the reason Trump’s reelection prospects are precarious is that his path to victory is narrow.
Finally, The Economist’s forecast also shows astonishing stability to the race over recent months. Apparently the country is so polarized that seemingly no event—be it the pandemic, the ensuing global recession, the nationwide Black Lives Matter protests—will move the needle very much:
According to 538’s presidential approval calculator, at https://projects.fivethirtyeight.com/trump‐approval‐ratings/?ex_cid=rrpromo, Trump’s approval rating over the past 4 years has been more stable, albeit usually underwater, than any president’s since at least the Truman administration in 1945. Love him or loathe him, opinion of Donald Trump has barely budged for years.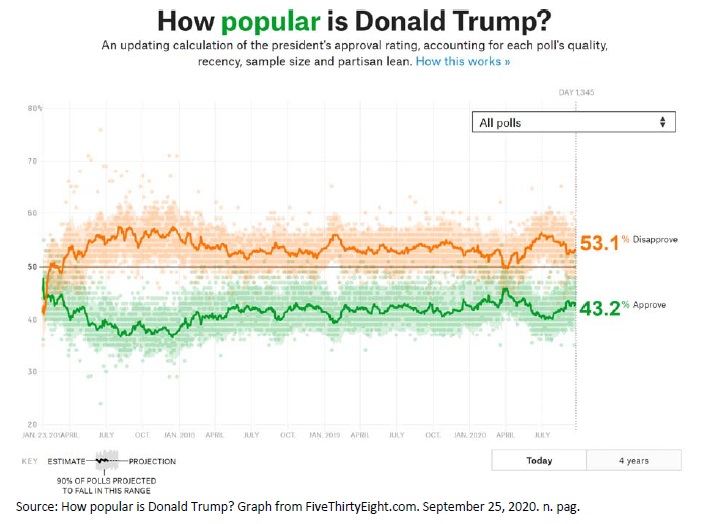
- Nate Cohn of the New York Times/Upshot, and Harry Enten of CNN. Both are excellent analysts on twitter and in their writings; Cohn’s work at the New York Times is accessible via subscription. It’s worth making a particular note of a twitter thread by Cohn on September 10th with respect to the “shy Trump voter” theory, under which Trump voters are undercounted in surveys because many are reluctant to tell pollsters that they support Trump. (Thread is at https://twitter.com/Nate_Cohn/status/1304013950917521409).
Cohn’s argument is that the simple “shy Trump voter” theory doesn’t pass the smell test—Trump is performing equally in telephone and online polls (with the latter providing more anonymity), Trump’s approval among Republicans is 90+ percent (no reluctant support there), and the “boaters for Trump” parades really exemplify the idea that Trump voters are quite vocal in their support. There may be shy Trump voters in, say, Manhattan, but they could be countered by shy Biden voters in rural Indiana.
The better version of the shy Trump voter theory is that there could be a fundamental difference between Trump voters and other voters in terms of their willingness to respond to polls. If a significant fraction of Trump voters (but not Biden voters) refuse to participate in surveys, the surveys will overrate Biden’s support and underrate Trump’s. Survey response rates have plummeted in recent years, and surveys have become increasingly vulnerable to potentially biased samples.
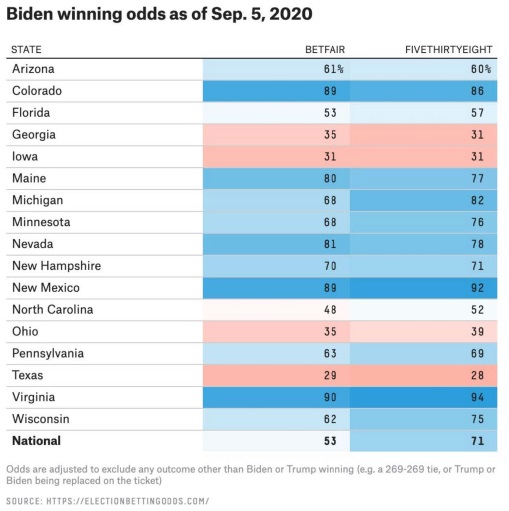
But this is all just theory‐‐not evidence that polls underrate Trump. In fact, polls did quite well in 2018, and you don’t need a shy Trump voter theory to explain 2016 (among other factors, late deciders broke heavily for Trump, and polls, while accurate nationally, underestimated Trump’s support among less educated whites, who made up a sufficient share of Rust Belt voters to flip Michigan, Pennsylvania, and Wisconsin to Trump). Biden is also clearly doing better with white working class voters than Clinton did. Overall, though, while Cohn is skeptical of the more sophisticated shy Trump voters theory, he can’t dismiss it—and neither can we—simply because polling and modeling the electorate is hard, and a certain amount of potential error comes with the territory. - Betting markets. We are believers that mature markets are generally efficient, in that mispricings are relatively rare, and those mispricings that do occur tend to close quickly. We are not believers, however, that election markets are mature. Betting markets currently have Biden at 54% to win the election, which is a marked difference from the views and models we’ve cited above. Could markets see something that the experts don’t? Maybe. But there is significant evidence of market mispricings, which Nate Silver cited on September 5th at Note that the Biden odds for his likely tipping point states—Pennsylvania, Michigan, Wisconsin, and Arizona—are all over 60%. Moreover, Biden has Florida and North Carolina as tossups as well. Yet, as Silver points out, Biden’s odds of winning the election on September 5th were only 53%. It’s hard to explain this as anything other than a mispricing—the national numbers simply don’t match the state numbers.
 https://twitter.com/NateSilver538/status/1302394190949736448.
Source: Biden winning odds as of Sep. 5, 2020. Graph from FiveThirtyEight.com, with data from electionbettingodds.com, and
posted on twitter.com. September 25, 2020. n. pag.
The bottom line in this election is that Trump is trailing and the clock is ticking. There is still time for him to close the gap, but given the hardening of opinion in this polarized country, he’s fighting an uphill battle as he seeks to regain support. If he can claw his way a few points closer, or if the polls are slightly off, his electoral college advantage may be just enough to win reelection.
Finally, it may be useful to describe Trump’s election odds with a more familiar analogy— football.
- If Trump’s chances are 25%, that’s the equivalent of an NFL team starting the second half of a game with the ball on its own 25, and trailing by 7, according to calculations from https://www.pro‐football‐reference.com/play‐index/win_prob.cgi.
- If Trump’s chances are 15%, that’s the equivalent of a team having the ball on its own 25, trailing by 7, with 13 minutes remaining.
Would you rather have the lead in such circumstances? Absolutely. But the race is far from over.
JMS Capital Group Wealth Services LLC
4900 Perry Highway, Suite 300 | Pittsburgh, PA | 15229 | 412‐415‐1177 | jmscapitalgroup.com
An SEC‐registered investment advisor. Securities may be offered through PWA Securities, Inc. Member FINRA/SIPC.
This material is not intended as an offer or solicitation for the purchase or sale of any financial instrument or investment strategy. Certain material in this work is proprietary to and copyrighted by Peak Advisor Alliance and is used by JMS Capital Group Wealth Services LLC with permission. This material has been prepared for informational purposes only, and is not intended to provide, and should not be relied on for, accounting and legal or tax advice. Any forecasts contained herein are for illustrative purposes only and are not to be relied upon as advice or interpreted as a recommendation.
‹ Back
Recent Posts
-

Good News, (Potential) Bad News on the Economy
June 5, 2026
-

Are There Rising Interest Rates on the Horizon?
May 29, 2026
-

May Charts and Links
May 15, 2026
-

The S&P 500 Has Reconcentrated
May 11, 2026
-

Iran Blockade… Two Weeks or Two Months?
April 24, 2026