


By using our website, you agree to the use of cookies as described in our Cookie Policy
Blog
Climate Charts
Noah Smith has an expansive summary of climate and energy developments, illustrated by a number of useful charts. The earth has undergone significant warming in the past 175 years, but some of the more apocalyptic scenarios, such as temperatures rising more than 4 degrees Celsius, appear unlikely:
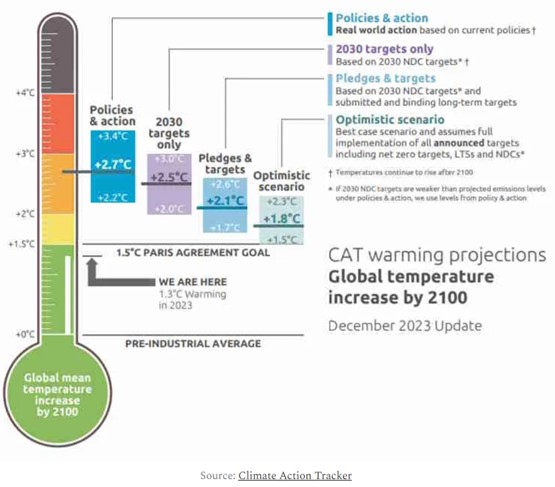
Warming of 1.5 degrees Celsius is probably already baked in, but policy responses and clean energy development appear likely to keep warming in the 2-3 degree range.
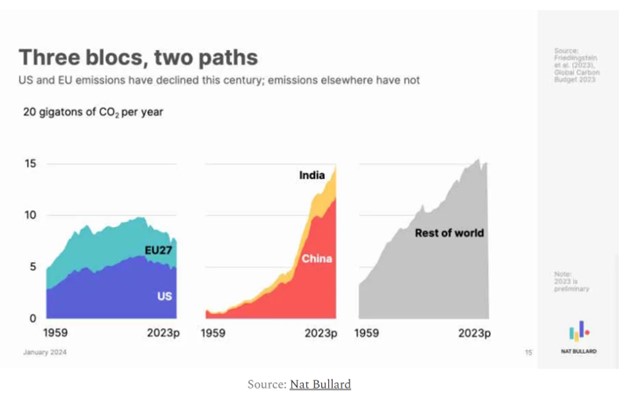
Carbon dioxide emissions have also become more broadly distributed, so that developed countries are responsible for a relatively smaller share than in years past; China is now the world’s largest CO2 emitter by a significant margin:
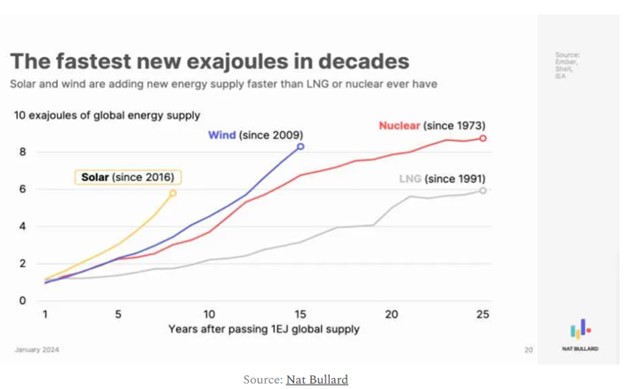
Green energy adoption is occurring rapidly:
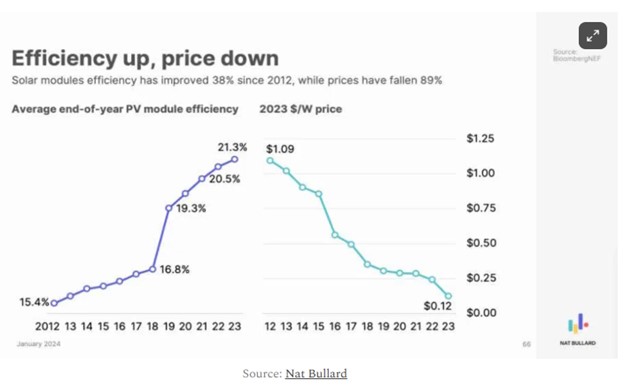
Costs of clean energy have fallen steeply, including solar energy:
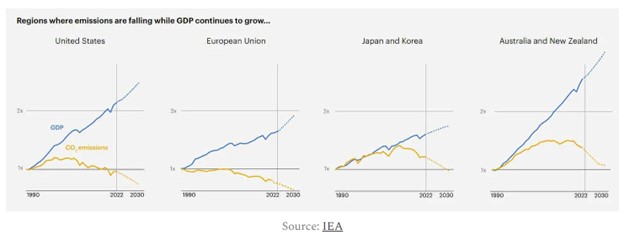
Economic growth and carbon dioxide emissions no longer move hand in hand. In many developed countries, the link has been broken:
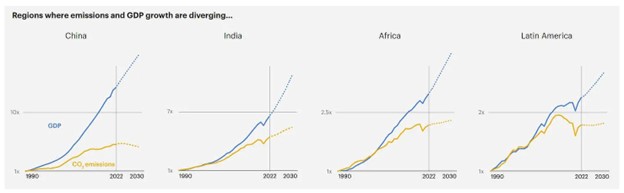
In numerous emerging markets, the ties between growth and emissions have weakened:
Smith argues that we have the technological tools to limit the damage from climate change without blocking economic growth. Though market forces amidst declining costs are a powerful tailwind to green energy, the rate and extent of climate change mitigation is ultimately a political question, to be addressed nationally and globally.
###
JMS Capital Group Wealth Services LLC
417 Thorn Street, Suite 300 | Sewickley, PA | 15143 | 412‐415‐1177 | jmscapitalgroup.com
An SEC‐registered investment advisor.
This material is not intended as an offer or solicitation for the purchase or sale of any financial instrument or investment strategy. This material has been prepared for informational purposes only, and is not intended to be or interpreted as a recommendation. Any forecasts contained herein are for illustrative purposes only and are not to be relied upon as advice.
Related Posts
‹ Back
Recent Posts
-

Good News, (Potential) Bad News on the Economy
June 5, 2026
-

Are There Rising Interest Rates on the Horizon?
May 29, 2026
-

May Charts and Links
May 15, 2026
-

The S&P 500 Has Reconcentrated
May 11, 2026
-

Iran Blockade… Two Weeks or Two Months?
April 24, 2026