
By using our website, you agree to the use of cookies as described in our Cookie Policy
Blog
The Stock-Bond Dynamic
As Callie Cox observes, bonds have a history of providing ballast in the event of equity downturns. She provides a chart illustrating this very point:
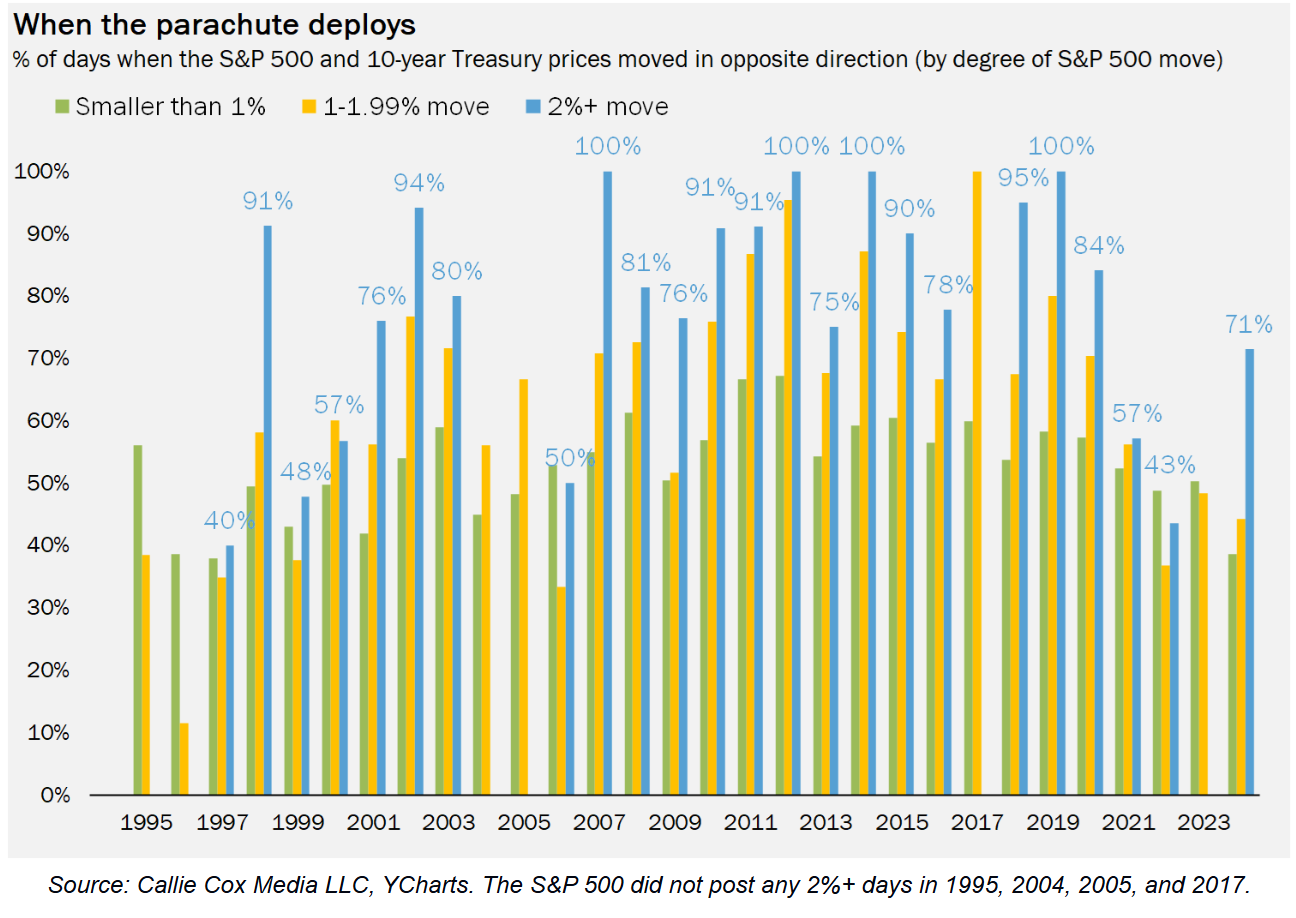
Most of the time, when stocks moved more than 2% in a day, 10-year Treasury prices moved in the opposite direction. If stocks were down, long-term bonds were up. However, 2022 saw both stocks and bonds nosedive, with bonds being hard-hit by inflation and the subsequent Fed response of rate hikes. Cox also cites December 18th and January 10th as recent data points in which the S&P 500 fell significantly but Treasuries declined as well.
But while Cox’s chart shows stocks and bonds typically moving in opposite directions, Russ Koesterich looks back further in time, with interesting results:
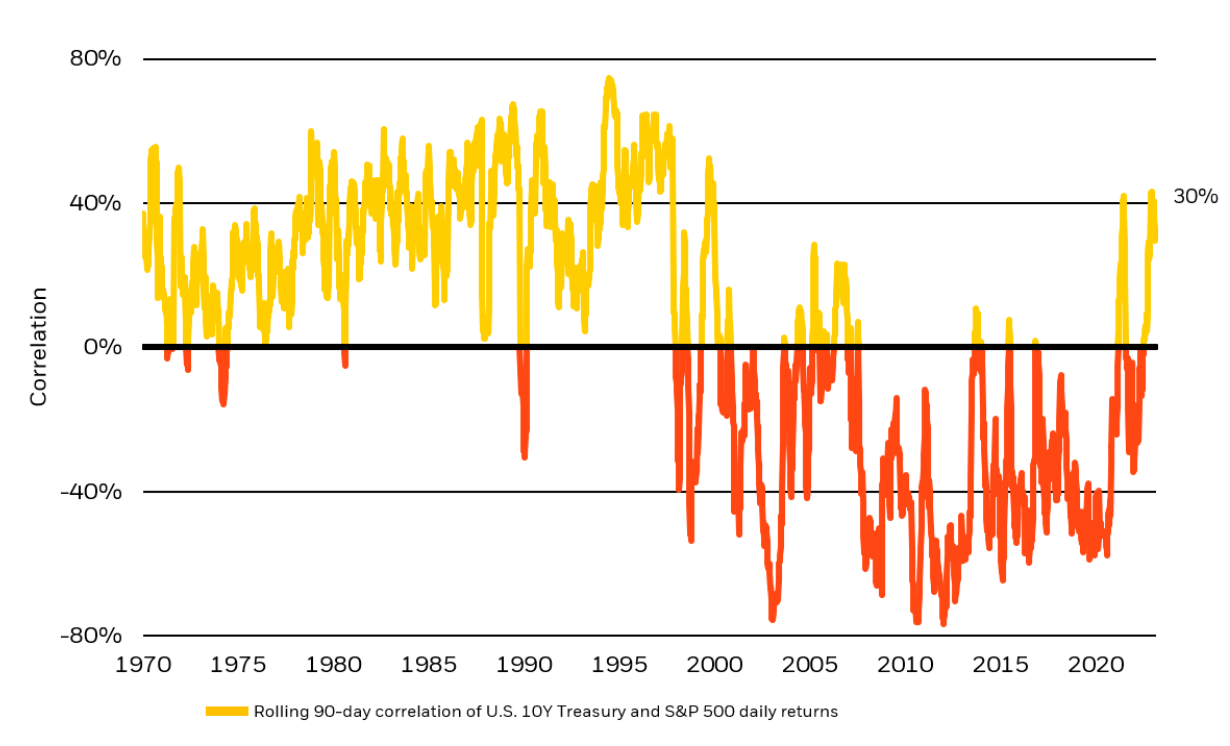 Source: Blackrock
From the 1970s through the late 1990s the S&P 500 and the 10-year US Treasury tended to move in the same direction—it’s only in the last 25 years or so that that relationship reversed. Koesterich suggests inflation volatility as a key driver of the stock/bond relationship, with a negative relationship more likely when inflation is low and stable.
While inflation has cooled, it remains elevated, and markets are anticipating that the Fed will keep the federal funds rate near 4% for the next two years. Large fiscal deficits and debt, along with anticipated tax cuts urged by the Trump Administration, may induce the Fed to maintain its hawkish stance to forestall any resurgence of inflation.
During these inflation-fighting times, long-term Treasuries may be less effective as portfolio ballast. As such, Cox suggests additional diversification within portfolios, such as shorter-term debt or greater cash holdings, may prove useful.
JMS Capital Group Wealth Services LLC
417 Thorn Street, Suite 300 | Sewickley, PA | 15143 | 412‐415‐1177 | jmscapitalgroup.com
An SEC‐registered investment advisor.
This material is not intended as an offer or solicitation for the purchase or sale of any financial instrument or investment strategy. This material has been prepared for informational purposes only, and is not intended to be or interpreted as a recommendation. Any forecasts contained herein are for illustrative purposes only and are not to be relied upon as advice.
‹ Back
Recent Posts
-

Good News, (Potential) Bad News on the Economy
June 5, 2026
-

Are There Rising Interest Rates on the Horizon?
May 29, 2026
-

May Charts and Links
May 15, 2026
-

The S&P 500 Has Reconcentrated
May 11, 2026
-

Iran Blockade… Two Weeks or Two Months?
April 24, 2026