
By using our website, you agree to the use of cookies as described in our Cookie Policy
Blog
Yield Curve Inversion

Does the Yield Curve Inversion Mean a Recession is on the Way?
Maybe, but while the yield curve inversion has historically been a harbinger of a recession, the Fed’s dovish response marks a break from its past behavior. We believe the inversion is a significant indicator of a slowing economy, but whether this translates to negative growth or merely slower growth is anyone’s guess.
The yield curve, as measured by the spread between the 3‐month and 10‐year Treasury rates, has been inverted for the past three months. This inversion has obviously lingered well beyond a temporary status, so it is time to reassess what it may portend, particularly with the spread between the 2‐year and 10‐year Treasury rates just turning negative as well.
Yield curve inversion means that short term interest rates (such as the 3‐month or 2‐year Treasury rate) have risen above long term rates (such as the 10‐year Treasury rate), so that the term spread (10‐year Treasury rate minus 3‐month or 2‐year Treasury rate) becomes negative. We monitor the yield curve because an inverted yield curve has historically been a harbinger of an impending recession1.
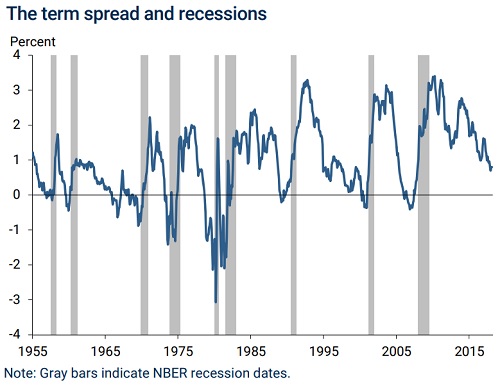
FRBSF Economic Letter, 2018‐07 | Research from the Federal Reserve Bank of San Francisco | 3.5.18 |
https://www.frbsf.org/economic‐research/files/el2018‐07.pdf
Why has an inverted yield curve been a precursor to economic downturns? Typically, we would expect investors to be more greatly compensated for longer term bonds rather than shorter term ones, due to the broader uncertainties and risks of the long run, such as inflation. An inverted yield curve can be a sign of tightening credit, as well as a relatively gloomy outlook with respect to long term growth.
As we know from the last recession, an inverted yield curve can give rise to a negative feedback loop. Banks, which borrow at short term rates and lend at long term rates, will reduce lending as it becomes less profitable. Investors, concerned about an impending recession, may pour money into long term government bonds, thereby driving down their yield even further and exacerbating the short vs long term spread.
Whatever the mechanism, there has been a strong historical correlation between an inverted yield curve and a recession. In the past 60 years, the yield curve (in the above chart, using the spread between the 1‐year and 10‐year Treasury rates) has inverted 10 times, and in 9 cases, a recession followed. The 10th case, while not a recession, was still an economic slowdown. It should be noted, however, that even while possessing value as a signal, the inverted yield curve says little about the timing of a recession. Historically, a recession has taken between 6 months and 2 years to occur after the inversion2.
However, there are reasons to believe that the predictive power of the inverted yield curve is diminished in this case. First, central banks around the world have been buying longer term bonds in extraordinary quantity, thereby depressing long term yields. Second, the natural rate of economic growth in the United States has likely fallen for numerous reasons, and this slowdown means that the long run natural rate of interest will be lower as well. Indeed, for whatever reasons, investors seem to show a virtually insatiable appetite for long term government bonds, even with their relatively paltry returns. It becomes almost axiomatic, then, that if long‐term rates are low, and if the natural spread between short and long term rates has shrunk in recent decades, then having the spread turn negative probably is not as ominous a sign as it was in the past.
Moreover, the yield curve is not the only game in town when it comes to forecasting recessions. Corporate profits, the unemployment rate, housing starts, and the leading economic index (LEI) all can provide recession warning signs. Right now, we are getting mixed signals—the yield curve has inverted and corporate profits have declined recently, but unemployment is still near record lows, LEI is still rising, and housing starts have been flat. If you squint a little you may project that the longer‐term indicators—the inverted yield curve and corporate profits—are forecasting a recession in 2020 or 2021, but these signals may indicate a slowing economy rather than a declining one3.
Finally, and critically, if the Fed now sees the yield curve as a sign of a potential recession and cuts rates in an effort to forestall a downturn, then the yield curve will lose much of its predictive value. As Tim Duy notes in Fedwatch4, “In my opinion, one key factor is that the Fed is cutting rates fairly early in the process; they are not dismissing the yield curve signal as they have done in the past.”
From the June Federal Reserve minutes, “Participants also discussed the decline in yields on longer‐term Treasury securities in recent months. Many participants noted that the spread between the 10‐year and 3‐month Treasury yields was now negative, and several noted that their assessment of the risk of a slowing in the economic expansion had increased based on either the shape of the yield curve or other financial and economic indicators.”
If there is anything that would certainly help kill the yield curve as a recession predictor, it would be the Federal Reserve believing that it was a recession predictor. In the past, the Fed has continued hiking after the 10 year / 2 year spread inverted; this time they will be cutting without a 10 year / 2 year inversion.
At JMS, we would argue that the best way to think about the inverted yield curve would be to consider it as a risk factor that would indicate an increased probability (but not certainty) of a recession within the next two years. A yield curve flattening is of little concern, but an inversion is a warning signal, albeit a muted one given the Fed’s newfound willingness to preemptively cut rates.
A recession within the next two years has become somewhat more likely, but we have been aware of this circumstance—as well as the extraordinary length of the bull market and the economic recovery and have taken these factors into consideration in our portfolio construction. As always, we are still seeking opportunities, but with a tilt towards wealth preservation in most portfolios.
Sources:
- https://www.frbsf.org/economic‐research/files/el2018‐07.pdf
- https://www.nytimes.com/2018/06/25/business/what‐is‐yield‐curve‐recession‐prediction.html
- https://www.americanfunds.com/ria/insights/upgrade_the_core.html
- https://blogs.uoregon.edu/timduyfedwatch/2019/07/15/still‐looks‐like‐25bp
JMS Capital Group Wealth Services LLC
417 Thorn Street, Suite 300 | Sewickley, PA | 15143 | 412‐415‐1177 | jmscapitalgroup.com
An SEC‐registered investment advisor.
This material is not intended as an offer or solicitation for the purchase or sale of any financial instrument or investment strategy. This material has been prepared for informational purposes only, and is not intended to provide, and should not be relied on for, accounting, legal or tax advice. Any references to future returns are not promises ‐ or even estimates ‐ of actual returns a client portfolio may achieve. Any forecasts contained herein are for illustrative purposes only and are not to be relied upon as advice or interpreted as a recommendation for a specific investment. Past performance is not a guarantee of future results.
‹ Back
Recent Posts
-

Good News, (Potential) Bad News on the Economy
June 5, 2026
-

Are There Rising Interest Rates on the Horizon?
May 29, 2026
-

May Charts and Links
May 15, 2026
-

The S&P 500 Has Reconcentrated
May 11, 2026
-

Iran Blockade… Two Weeks or Two Months?
April 24, 2026