


By using our website, you agree to the use of cookies as described in our Cookie Policy
Blog
As the Tariffs Turn…
CNBC’s Kif Leswing published an article on Friday assessing how much an iPhone would cost if it were manufactured in the United States instead of China. He cited one estimate suggesting that the price of an iPhone 16 Pro would rise from $1199 to $1500 from increased labor costs alone; another analyst pegged the US-made phone retailing for a whopping $3500. Perhaps not coincidentally, on Saturday, President Trump exempted smartphones, computers, and other tech equipment from reciprocal tariffs. However, on Sunday, Commerce Secretary Howard Lutnick said that separate tariffs on these products are coming soon.
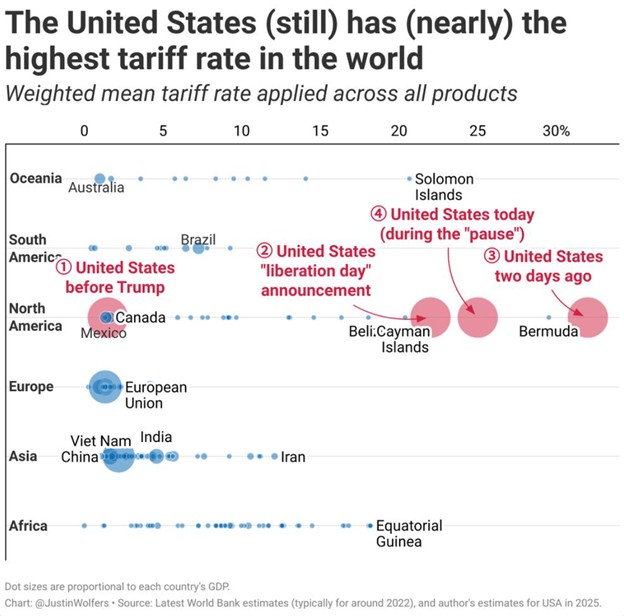
We are not going to pretend to have deep insight as to what tariffs will be on what products in 90 days. We have found three excellent charts that show both how historically high United States tariffs have risen this year, as well as how much in flux they’ve been. The first chart is from economist Justin Wolfers (and was current as of Friday):
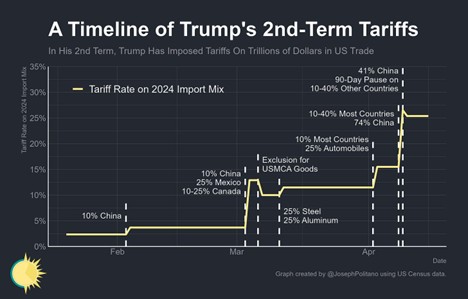
The second chart is from Joseph Politano of Apricitas Economics, and shows a tariff timeline:
The third chart is also from Politano, and calculates tariffs based on import categories:
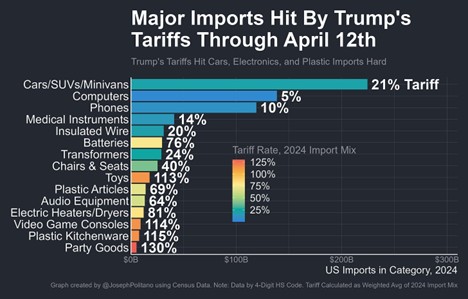
While toys, video game consoles, plastic kitchenware, and party goods face higher tariff rates, the larger tariff impact is from motor vehicles, computers, and phones, as consumer spending on these products are quite high. Where tariffs go from here is anyone’s guess, but we are now starting from tariff levels that are higher than they’ve been in decades.
JMS Capital Group Wealth Services LLC
417 Thorn Street, Suite 300 | Sewickley, PA | 15143 | 412‐415‐1177 | jmscapitalgroup.com
An SEC‐registered investment advisor.
This material is not intended as an offer or solicitation for the purchase or sale of any financial instrument or investment strategy. This material has been prepared for informational purposes only, and is not intended to be or interpreted as a recommendation. Any forecasts contained herein are for illustrative purposes only and are not to be relied upon as advice.
Related Posts
‹ Back
Recent Posts
-

Good News, (Potential) Bad News on the Economy
June 5, 2026
-

Are There Rising Interest Rates on the Horizon?
May 29, 2026
-

May Charts and Links
May 15, 2026
-

The S&P 500 Has Reconcentrated
May 11, 2026
-

Iran Blockade… Two Weeks or Two Months?
April 24, 2026