


By using our website, you agree to the use of cookies as described in our Cookie Policy
Blog
How High Can Oil Prices Go?
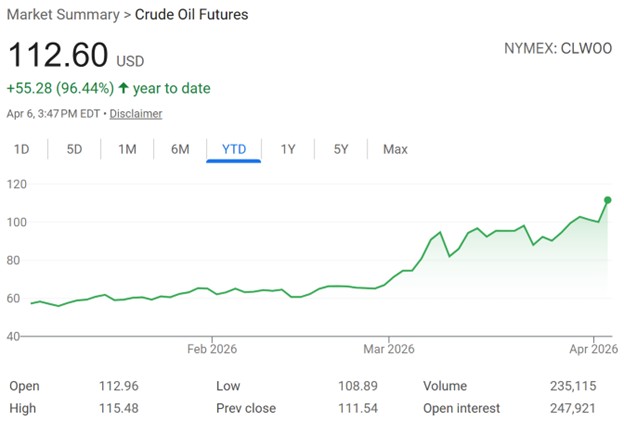
As the Iran war has unfolded, oil prices have risen considerably:
How high can oil prices go? The answer depends on the extent to which oil flows from the Persian Gulf are diminished, and on the extent to which oil consumption is affected by changes in the price of oil. CNN cites experts who state that a prolonged conflict could plausibly lead to oil prices exceeding $200 per barrel.
Two economists, Robin Brooks and Paul Krugman, provide charts detailing their expectations of oil prices under varying oil supply reductions and oil demand elasticities. Oil demand tends to be inelastic in the short term, as it is difficult for individuals or firms to cut back on oil usage or substitute away from it.
Brooks’s chart covers a wide range of oil volumes emanating from the Persian Gulf, and a range of demand elasticities of 0.1 to 0.2:
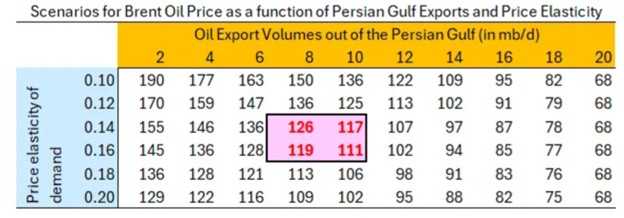
Brooks argues that the United States should initiate an embargo of Iranian oil—in other words, if Iran refuses to let oil flow freely through the Strait of Hormuz, then the United States should block tankers carrying Iranian oil as well. Iran exports about 2 million barrels of oil per day, so by Brooks’s estimate, cutting off Iranian oil exports would raises oil prices by only about $10 per barrel across a wide range of oil volumes and elasticities. Brooks highlights in pink the middle range of a price elasticity of around 0.15, and oil export volumes starting at about half capacity at 10 million barrels per day, but overall you’d need very low elasticity combined with a near shutdown of Persian Gulf exports to see oil prices near $200 per barrel.
Krugman’s chart is considerably more alarming. He states that about 20% of the world’s oil production passes through the strait of Hormuz, and provides the following chart estimating oil prices in the event of 8%, 12%, and 16% global oil supply reduction (a 10% global reduction should roughly correspond with a 50% reduction in oil export volumes out of the Persian Gulf), with oil demand elasticities ranging from 0.1 to 0.2:
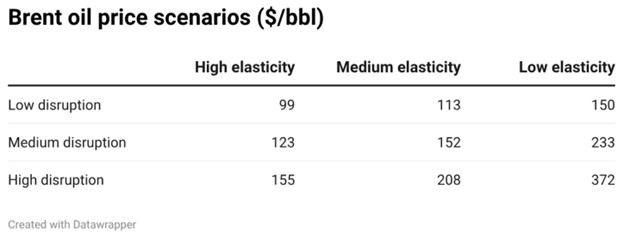
The main difference between Brooks’s and Krugman’s charts is the sensitivity of oil prices to supply disruptions. At an elasticity of 0.15, Brooks’s chart has oil prices rising to $150 at most, whereas Krugman’s chart has an oil price of $208 per barrel under a high disruption scenario. Krugman’s high disruption with low elasticity scenario yields an oil price of an astounding $372 per barrel.
For now, the movement in oil prices is similar to that which occurred in the initial stages after Russia’s invasion of Ukraine in 2022:
Going forward, there’s considerable uncertainty about the risks of the Strait of Hormuz remaining near-closed, and the risks of escalation, if Iran retaliates by damaging oil infrastructure in neighboring countries. If Brooks is right, further measures against Iran, whether an embargo or further bombings, may have only a moderate impact on oil prices. If Krugman is right, then a prolonged war could result in much more severe economic consequences.
JMS Capital Group Wealth Services LLC
417 Thorn Street, Suite 300 | Sewickley, PA | 15143 | 412‐415‐1177 | jmscapitalgroup.com
An SEC‐registered investment advisor.
This material is not intended as an offer or solicitation for the purchase or sale of any financial instrument or investment strategy. This material has been prepared for informational purposes only, and is not intended to be or interpreted as a recommendation. Any forecasts contained herein are for illustrative purposes only and are not to be relied upon as advice.
‹ Back
Recent Posts
-

Good News, (Potential) Bad News on the Economy
June 5, 2026
-

Are There Rising Interest Rates on the Horizon?
May 29, 2026
-

May Charts and Links
May 15, 2026
-

The S&P 500 Has Reconcentrated
May 11, 2026
-

Iran Blockade… Two Weeks or Two Months?
April 24, 2026