


By using our website, you agree to the use of cookies as described in our Cookie Policy
Blog
Inflation History, Revised
Leuthold’s historical analysis of the S&P 500 provides a major note of concern:
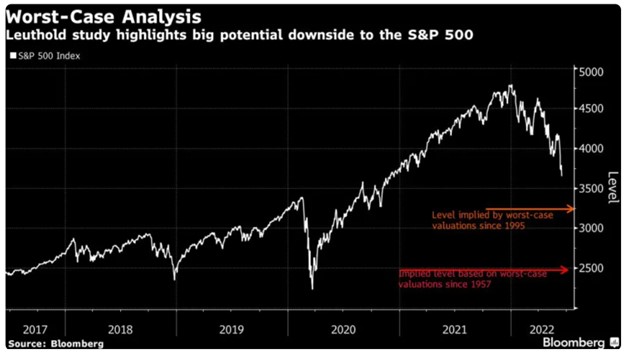
Bloomberg’s Lu Wang describes these bad-case scenarios outlined by Leuthold that show the S&P 500 potentially has a long way it could further fall. As Wang observes, Leuthold’s models rely heavily on historical valuations, and valuations have been elevated for many years, and even more so during the pandemic recovery.
We want to call attention to the two color lines in the graph. Each are based on valuations falling to the 25% percentile of their historical norms. The orange line, which uses data since 1995, shows a potential 11% drop from June 16th, which would obviously be bad. However, the red line, which uses data since 1957, shows a potential 32% drop, which would be much worse. How much history should we use? What’s the best way to compare apples to apples?
We don’t have an answer to this question, but we do want to segue into another critical example of economic history, the history of inflation. Economists Marijn Bolhuis, Judd Cramer, and Larry Summers have written a new working paper in which they attempt to compare the current spike in inflation to previous inflation surges.
The critical argument of the paper, as noted by Fortune’s Tristan Bove, is that the construction of the Consumer Price Index (CPI) has changed over time. The authors specifically focus on a 1983 change in the way the CPI treated housing spending, as the pre-1983 method was “without conceptual foundation”. The authors then construct new series for CPI headline and core inflation that are “more consistent with current practice and expenditure shares for the post-war period”. If their methodology is correct, Bolhuis, Cramer, and Summers would be providing a better apples-to-apples comparison between today’s inflation and inflation from the 1970s and early 1980s.
The authors argue that the pre-1983 measure of inflation was biased upwards, and that the official June 1980 peak core inflation rate of 13.6% would be only 9.1% after adjusting for the treatment of shelter inflation. They also estimate that the local trough of inflation in 1983 was significantly higher, at 4.3%, than the reported number of 3.0%.
What’s the implication of these revised numbers? From July 1980 to July 1981 the Fed under Paul Volcker raised the federal funds rates from 9% to 19% in an effort to tame inflation. It worked, eventually, but in the interim unemployment rose to over 10%. Core inflation as reported in the CPI fell from 13.6% in June 1980 to 3.0% in July 1983. But if Bolhuis, Cramer, and Summers are correct, this disinflation number is an overestimate, and the decline should be measured as only 4.8%--the difference between 9.1% and 4.3%. The massive 10% increase in the federal funds rate resulted in less than a 5% drop in inflation.
Now consider where we are today. Core inflation was at 6.5% in March, and the Fed’s target inflation rate is purportedly 2%. The implication of this paper is that it may take much steeper rate hikes to curb inflation than previously believed. If so, the Fed, led by Jerome Powell, may face the difficult choice of risking a deep recession to achieve the Fed’s target, or adjusting its target to acquiesce to inflation above 2%.
###
JMS Capital Group Wealth Services LLC
417 Thorn Street, Suite 300 | Sewickley, PA | 15143 | 412‐415‐1177 | jmscapitalgroup.com
An SEC‐registered investment advisor.
This material is not intended as an offer or solicitation for the purchase or sale of any financial instrument or investment strategy. This material has been prepared for informational purposes only, and is not intended to be or interpreted as a recommendation. Any forecasts contained herein are for illustrative purposes only and are not to be relied upon as advice.
‹ Back
Recent Posts
-

Good News, (Potential) Bad News on the Economy
June 5, 2026
-

Are There Rising Interest Rates on the Horizon?
May 29, 2026
-

May Charts and Links
May 15, 2026
-

The S&P 500 Has Reconcentrated
May 11, 2026
-

Iran Blockade… Two Weeks or Two Months?
April 24, 2026