


By using our website, you agree to the use of cookies as described in our Cookie Policy
Blog
Looking Ahead to 2026
Will the S&P 500 rise or fall in 2026? We don’t have a crystal ball, and neither does Ben Carlson, but Carlson gives some historical context to market movements over past decades. He provides several noteworthy chart, including this one about market downturns:
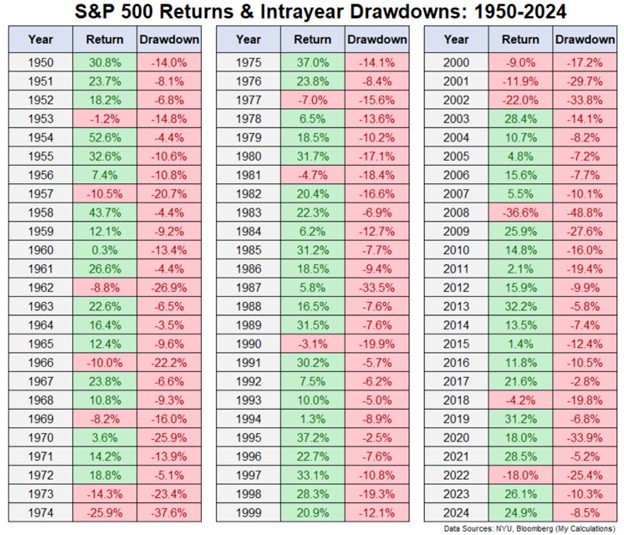
During 15 of the past 25 years, the S&P 500 has undergone a peak-to-trough downturn of greater than 10%. But a downturn doesn’t mean all is lost—in 9 of those 15 years that saw the S&P 500 slide 10% from its zenith, the stock index achieved a positive return by year’s end; in 6 of those years the S&P 500 gained over 10%. Carlson points out that since 1928, the average in-year peak-to-trough decline is 16%. Even in good years, there are often bad stretches.
In the same vein, Carlson remarks that although the S&P 500 generally returns about 8%-10% annually over the long run, in the shorter term movements are typically much larger, as depicted in this chart:
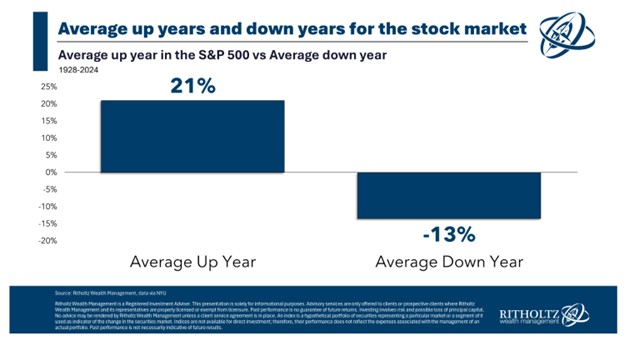
When stocks do well, they often do very well, and when they fall, double-digit losses are common.
While many investors are understandably wondering how long the AI boom can last, history suggests a wide range of outcomes are plausible—in the past 6 years (including 2025, as of December 3rd), the S&P 500 climbed at least 16% in 5 of those 6 years, while plunging 18% in 2022. Large year-to-year swings are common, and portfolios should be constructed and maintained with that fact in mind.
JMS Capital Group Wealth Services LLC
417 Thorn Street, Suite 300 | Sewickley, PA | 15143 | 412‐415‐1177 | jmscapitalgroup.com
An SEC‐registered investment advisor.
This material is not intended as an offer or solicitation for the purchase or sale of any financial instrument or investment strategy. This material has been prepared for informational purposes only, and is not intended to be or interpreted as a recommendation. Any forecasts contained herein are for illustrative purposes only and are not to be relied upon as advice.
‹ Back
Recent Posts
-

Good News, (Potential) Bad News on the Economy
June 5, 2026
-

Are There Rising Interest Rates on the Horizon?
May 29, 2026
-

May Charts and Links
May 15, 2026
-

The S&P 500 Has Reconcentrated
May 11, 2026
-

Iran Blockade… Two Weeks or Two Months?
April 24, 2026