


By using our website, you agree to the use of cookies as described in our Cookie Policy
Blog
The Economy in Charts
If a picture is worth a thousand words, then charts may provide a better view of the economy than pages of verbiage. Timothy Lee at Full Stack Economics has created a series of charts that are intended to provide a snapshot of interesting aspects of the US economy. We’ll highlight a few of them below:
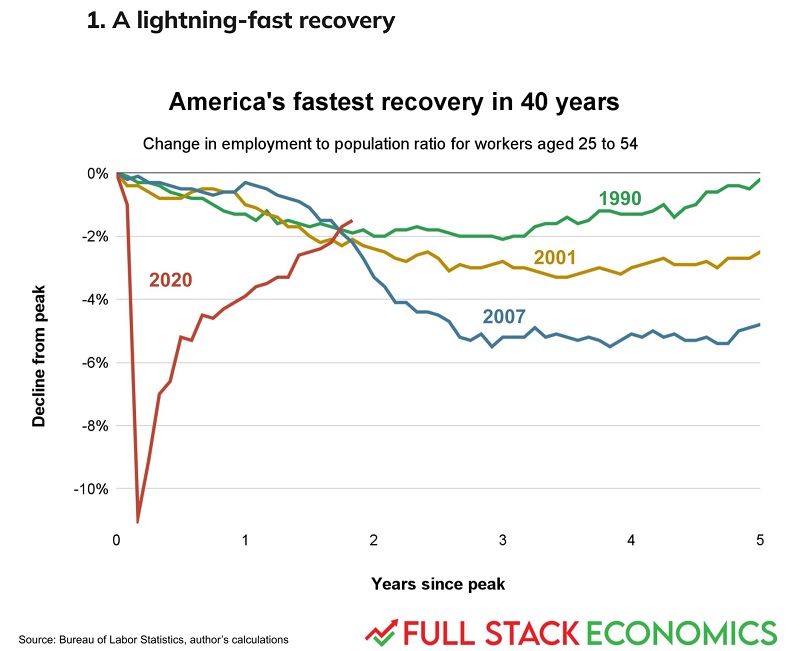
The decline in employment for prime-age workers was sudden and steep, but the recovery has been remarkably quick. We’re on pace to be at the pre-pandemic ratio later in 2022. Of course, one piece of employment recovery was massive fiscal and monetary policy stimulus, which has likely contributed to another current phenomenon:
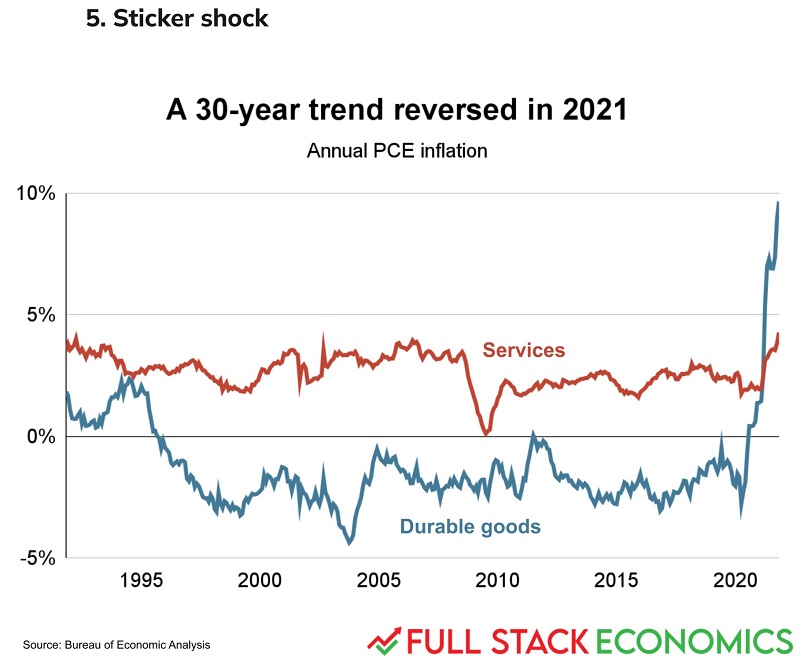
Inflation has risen to 7%, with the sharp spike in durable goods prices as the primary culprit. Why durable goods? With so many people flush with stimulus cash, and reluctant to spend on travel, restaurants, and other services, more money was spent on durables. Supply chain issues, in part driven by increased demand, have likely played a role as well. Lee points out, though, that the recent rise in services prices may be more of a concern longer-term, as services comprise a much larger share of the economy than do durable goods.
Was rapid employment recovery worth the cost of higher inflation? The answer to that question probably depends on how persistent inflation is. 1-2 years of transitory inflation would be much more palatable than persistent inflation that becomes embedded into consumer expectations, possibly generating a wage-price spiral.
Of course, the Fed is currently telegraphing that it will raise rates multiple times this year; we hope that inflation cools relatively quickly, because if it doesn’t, then we face another difficulty:
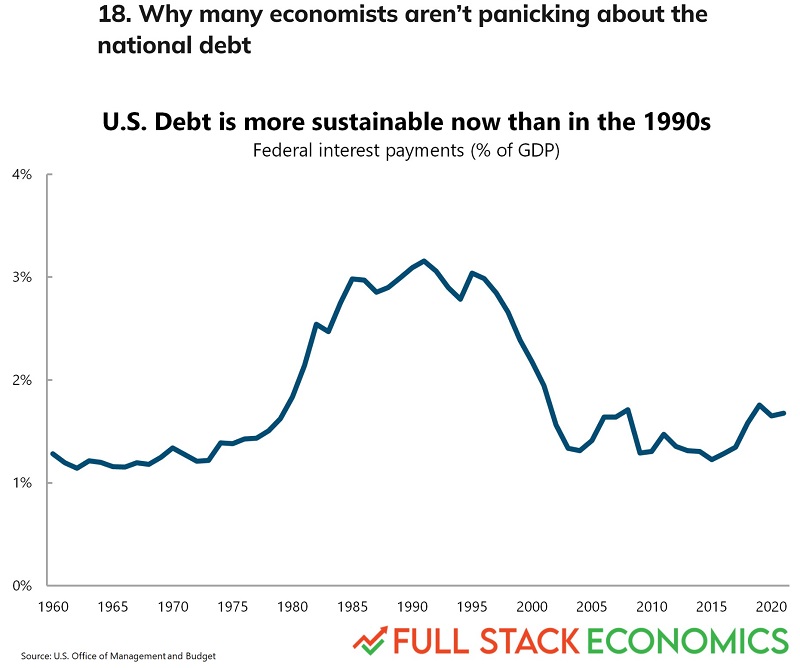
Low interest rates have enabled the government to take on more debt without increasing federal interest payments relative to GDP. If the 10-year rate rises to 5%, as it was in 2001, then the economy will suffer the twin burden of higher rates and greater fiscal strain from the debt. To be sure, as of January 24th, the current 10-year rate is 1.75%, and the 30-year rate only 2.10%, so markets aren’t overly concerned at the moment. Moreover, the Federal funds rate was over 2% in 2019, so there’s room for several rate hikes from its current near-zero level. However, debt concerns may eventually constrain the Fed’s ability to raise rates beyond a certain point; while we generally believe it’s unwise to bet against markets, in this case we are certainly hoping that markets are correct, and that the Fed has the ammunition to pare back inflation, because otherwise we may face significant economic dilemmas.
###
JMS Capital Group Wealth Services LLC
417 Thorn Street, Suite 300 | Sewickley, PA | 15143 | 412‐415‐1177 | jmscapitalgroup.com
An SEC‐registered investment advisor.
This material is not intended as an offer or solicitation for the purchase or sale of any financial instrument or investment strategy. This material has been prepared for informational purposes only, and is not intended to be or interpreted as a recommendation. Any forecasts contained herein are for illustrative purposes only and are not to be relied upon as advice.
Related Posts
‹ Back
Recent Posts
-

Good News, (Potential) Bad News on the Economy
June 5, 2026
-

Are There Rising Interest Rates on the Horizon?
May 29, 2026
-

May Charts and Links
May 15, 2026
-

The S&P 500 Has Reconcentrated
May 11, 2026
-

Iran Blockade… Two Weeks or Two Months?
April 24, 2026
Comments